
What is learning analytics?
Learning analytics is an essential component that completes all the L&D activities in an organization. Analytics can be used to check their efficiency, optimize costs, improve performance. As a consequence, it supports the strategic objectives of the company and has a positive influence on employee engagement.
What is learning analytics, in fact? According to the definition presented at The 1st International Conference on Learning Analytics and Knowledge, it involves the measurement, collection, analysis, and reporting of information concerning training participants in order to understand and optimize the process of learning and the environment where this process takes place.
Why do learning analytics projects often fail?
Collecting large amounts of data and drawing conclusions based on that data is often an overwhelming task for L&D teams. Is this a result of their lack of knowledge concerning analytics in the functioning of modern organizations? By no means! HR teams know the value of analytics very well and their knowledge derives from their own observations as well as available reports and studies. For many years now, they have confirmed the effectiveness and competitive advantage of companies where data-based management has been introduced. And yet, the metrics that are usually taken into account by HR departments (including the L&D teams especially) often fail to reach their objectives. This happens for various reasons.
The biggest mistakes – and the most common ones – made by L&D teams that use analytics are:
- Lack of a consistent learning analytics strategy, aligned with the strategic goals of the organization.
When developing a strategy, they usually treat the scope of the analytics as the starting point. In fact, the question is not “What do we want to analyze?” but rather “Why do we want to analyze this?” and “How are we going to use this data?”. - Lack of understanding and support from the organization, including the executives, who usually think that development activities are not relevant for their business goals. Research shows that only 40% of companies believe that their learning strategy is aligned with their business goals. It naturally follows that the executives are distrustful of L&D, as they are mostly focused on reaching their business goals.
- Inadequate and incomplete L&D tools often fragmented across the organization and managed by the IT departments that never treat them as a priority.
Lack of a platform that could ensure quick, safe, and complex access to data is a real challenge. It can actually discourage the organization from making practical use of analytics and limits its operation considerably. - Limited HR budget that is not sufficient to cover the costs of buying adequate tools and employing analytics specialists to make full use of them.
- Skyrocketing expectations concerning quick return on investment and changes in all fields of a given business.
The companies that follow the trend of analytics-driven business wish to see immediate change and they focus on an excessively broad range of activities. Instead, they should select at most five initiatives that might bring the highest value in the shortest time. Failed expectations hinder future investment. - Lack of experts with proper analytical qualifications concerning the extraction of relevant data from various sources, who are also able to analyze the collected information accurately and make conclusions based on that.
Poor knowledge of basic and advanced tools is another problem. MS Excel still reigns in L&D departments, even though there are so many new and better IT solutions available. - Lack of insightful analysis and understanding of the subject, both on the part of L&D departments and the management.
Neither of them knows for sure what use to make of the available tools and experts. Expert knowledge is crucial here, as it makes it possible to discover the true objectives of the organization and present them by means of appropriate data. Superficial knowledge gives superficial results.

It is quite hard to point to a single dominating cause of the failures in using learning analytics in practice. Every project that is being carried out especially projects with serious consequences, should be based on in-depth knowledge and solid theoretical foundations. If these are lacking, issues are likely to come up at various stages of the organization’s operation. However, knowledge in the field of analytics is neither widespread nor easily available. This publication is a thorough guidebook concerning the application of analytics in the area of Learning & Development. It will come of use to anyone who’d like to introduce learning analytics in their organization. Let’s start with the fundamentals.
What is the difference between data analysis and data analytics?
Data analytics is not the same thing as data analysis. Analytics is a method of strategic information management in a company, concentrated on action, whose goal is to move from the starting point to the expected result. Learning analytics revolves around a broad spectrum of activities connected with L&D processes in an organization to prove their efficiency and effect on the expected outcomes as well as to facilitate these processes. In a nutshell, analytics helps in making the right decisions at the right moment.
Data analysis is a process comprising the examination, transformation, and arrangement of a set of data in a given manner in order to study its individual parts and extract useful information. This definition does emphasize one thing: data analytics is an umbrella term that includes data analysis and complete data management. It also encompasses data collection, organization, storage, and all the tools and techniques used as well as taking adequate steps on the basis of collected information in order to achieve the company goals.
What are the types of analytics?
How to find your way in the overwhelming jungle of L&D data? Start from making it clear what questions you actually want to answer and then find a proper methodology to find these answers. Depending on the user’s needs, there are four types of analytics (descriptive, diagnostic, predictive, and prescriptive) that help organizations acquire various types of data and thus find the answers to their specific questions.

Descriptive analytics
“What has happened?”
This is the most fundamental form of analytics and collecting data from various sources. By applying it in the area of L&D, you can use the information to make decisions regarding future training plans. Thanks to descriptive analytics, you will find out, for example, how many employees started their training program and how many completed it; or which courses are most popular, and which are the opposite. The results will not give you a detailed insight into the cause of a given situation: they will show you its outcomes. Descriptive analytics explains the situation post-factum; it gives you a chance to make your own conclusions and plan improvements, but it does not provide many details.
Diagnostic analytics
“Why?”
The information you receive by applying diagnostic analytics will help you find the causes of past events – not only their outcomes. It is a more insightful type of analytics but still with rather limited possibilities of providing advanced practical information. It can be used, for instance, to discover that the low attendance in a leadership program was caused by the inadequate thematic scope. However, only a more in-depth study will reveal the scale of the situation. The areas that need further analysis as well as certain patterns and relationships can be determined by means of this type of analytics. How to do that? You need state-of-the-art tools for this purpose.
Predictive analytics
“What will happen?”
Of course, it is impossible to foresee the future, but in this case, the advanced and large-scale processes of data collection allow making estimates in regard to the consequences of particular actions and the probability of a given occurrence. Predictive analytics is based on approximate predictions that can change when other variables are introduced. Modern predictive analytics tools are founded on data science technologies that use complicated algorithms and statistics. Their efficacy is increased by acquiring data from a number of sources. It is typically used in prognosing opinions about a product on the basis of data collected on social media. One of the simplest uses of predictive analytics in L&D is adapting the form of a course (on-site, online, microlearning, gamification) to the participants, following their previous preferences and engagement in learning processes.
Prescriptive analytics
“What can be done?”
Apart from collecting data, making diagnoses, and predicting outcomes, another step is necessary to find the best solution to the problem: this is what prescriptive analytics does. It can be used to make better and more precise decisions. The mechanism of prescriptive analytics is quite advanced: it employs specialized algorithms to support optimization. It is best used when large amounts of data and variables must be analyzed. However, the company itself must decide whether the generated recommendations are worth following.
The four types of analytics form a series of steps to take, grounded on planning. Even if an organization uses descriptive and diagnostic analytics only, it must base its activities on continuous and active cooperation with L&D experts, stakeholders, analysts, and planners, who can jointly make the best decisions supported by reliable data.
How should a learning analytics process in an organization look like?
The effectiveness of using HR and learning analytics is confirmed by a number of studies and reports. A report by Bright & Company reveals that 81% of the respondents declare that at least one of their learning analytics projects has had a positive business impact. To make this happen on a larger scale and to guarantee that training analytics brings profits both to L&D departments and the whole organization, you need to build an analytics strategy, following the best practices on the market. In the next sections, we are going to show you where to start, what tools to use, and what metrics to take into account.
Taking the human factor in data into account
The first stage of any project is the preparation of the foundation for the planned changes. In all his articles and speeches, David Green, an HR analytics expert, underscores the importance of ethics in all the activities related to data collection and processing, especially for HR purposes. Any negligence in this respect may cost you the loss of your employees’ and managers’ trust. Green suggests that clear principles should be set first and foremost, to guarantee the sense of safety both to you and to the people whose data you collect.
The next step is making sure you are supported by the right people – the people who can share their knowledge and experience with you. The third stage involves the identification of all the stakeholders of your analytics activities and building a good rapport with them. Their number may turn out to be quite big, but you need to remember that they will set the direction of your analytical work. Hence, you have to become familiar with their needs and expectations as well as let them know what benefits and opportunities learning analytics will bring them. It is also important to plan your communication strategy that takes all the stakeholder groups into consideration: including your employees. Make sure that they are also the beneficiaries of your research. The benefits cannot only apply to the company and its goals; the people also need to profit from these processes.

What is the data analytics maturity model and how to use it in practice?
In her conversation with HCM Deck, Lori Niles-Hofmann from NilesNolen proposes that your adventure with L&D data analytics should begin from finding out what happens in the organization at the particular moment in this respect. Lori points out that you should start by talking to your IT and HR teams, reviewing the tools you already have, verifying the possibilities of your digital and employee development platforms, and gathering information about the data that is currently being collected. Data analytics specialists from McKinsey & Company are of the same opinion: they encourage the use of existing platforms wherever possible. This way, you can avoid investing in costly and extensive tools before you even get to know the current needs and opportunities. To learn at what stage of L&D data analytics your company is, you can use the data maturity model.
Company maturity in terms of data analytics
In the report created by ROI Institute and i4cp, almost 400 L&D practitioners and leaders, and HR analysts defined the kinds of data analytics projects implemented at their companies at that point and the types of similar projects planned for the next year. More than 80% of the organizations stated that they only generated descriptive and ad hoc reports that responded to the basic questions: how, how often, where. Another 9% of the companies did not take any steps in that field but they planned to introduce them in the upcoming months. Over 50% of the companies wanted to introduce modern predictive analytics tools, but only 20% of the companies were using them at that point. Nowadays, less than 20% of companies use machine learning, optimization, or experimental design. On the other hand, 30% percent of the organizations intend to do that in the future. The statistics show that companies become increasingly aware in the field of applying advanced analytics in their operations and they see a real value for the business in that.
What stage are you at right now?
Data maturity modeling is a useful tool for defining quickly and easily at what stage of learning analytics you are right now. You can use this tool before setting off strategic planning (or revising your activity in this field).
Level 0 – means a total lack of projects in the field of data analytics: data is not collected or is rarely collected and data analysis is fundamentally erroneous.
Level 1 – data is collected for some areas of the business and processed for their internal purposes, but there is no coherent strategy or a wider perspective.
Level 2 – data is collected in a safe and trustworthy way, but to a limited extent.
Level 3 – the department has access to a large scope of data that can be used without the involvement of other providers (e.g. the IT team) and it has resources to draw correct conclusions.
Level 4 – the collected data is presented in an accessible way and its quality allows making the best decisions that support the strategy of the organization.
Level 5 – all the decisions in the organization, including those related to improvements and investments, are taken on the basis of data.

Based on WWT’s Data Maturity Curve
In one of our expert webinars, Szymon Janicki, HCM Deck CEO & co-founder, said that companies must base their actions on data from the first days of their existence and they should try to base all their decision-making on data as well. His conclusions were derived from his own experience and the experience of HCM Deck’s clients.
***

***
What to measure or how to set the right KPIs?
L&D specialists, who only start their journey to learning analytics usually ask the same basic question: what should be analyzed? There are many answers to this question, in fact. The road taken to defining the analytical goals in line with the company’s objectives, culture, and values is crucial. Rafał Salamonik, Head of Learning & Development at BNP Paribas Bank in Poland, believes that there is another, more important question: why should these aspects be measured?. You need to find out what value your actions will bring to people and business. Partnerships are of paramount importance here.
How to build a partnership with stakeholders and where to begin?
Rafał Salamonik is sure that the direction of any L&D strategy is defined by the business strategy of the company. The indicators you measure should directly follow the needs of your stakeholders. Only this way will you gain strong engagement at all levels of management, top to bottom deep into the organizational structure. As a study by McKinsey & Company reveals, 57% of the companies that are most successful thanks to analytics have the full support of middle management. Managers believe that advanced analytics will help them maintain their positions and competitiveness. To find this kind of support for your learning analytics actions, again, you need to ask yourself the right questions before bringing this subject up with the management and stakeholders.
- What are the goals of the organization?
- What are the business problems?
- What factors influence the financial results?
- What factors influence employee engagement and efficiency?
First, discuss these questions within the L&D team to be able to check and reinforce the responses at later stages. They will give you sufficient grounds for creating the right KPIs. You need to bear in mind, though, that before the talks, you have to arm yourself with adequate knowledge that will help you build trust and reliability.
- What data, from the L&D perspective, may be interesting for the stakeholders?
- What tools and resources are available within the organization to acquire the necessary data?
- What tools are missing?
- How to present the results to make them useful for the organization?
- How to measure the effectiveness of particular activities?
What are the best practices of KPI setting?
Key Performance Indicators are used to measure the success of an organization. In other words, they serve to evaluate the effectiveness of particular activities. In the case of L&D departments, KPIs can show you how the L&D programs implemented at your company support the fulfillment of the company’s objectives. This is not all, though. Carefully selected indicators will also help you draw conclusions and make decisions. What principles should be followed when setting the KPIs for your L&D activities?
- Start by deciding what you want to do with the data you gather.
Andrzej Borczyk, HR Director and Board Member at Grupa Żywiec, says: “If we measure something, we mean to take some action: make conclusions based on our metrics and take business decisions.” Arriving at the right conclusions is the key, rather than data collecting as such. - L&D analytical processes should be planned with a focus on the employee life cycle in the organization.
This is another piece of advice given by Andrzej Borczyk. Make sure that your KPIs include end-to-end training processes, from their implementation to employee development and engagement, to the reasons why employees leave the company. - Adapt the indicators to your organization’s goals and the stage at which the L&D department is at the moment.
You can use the data maturity model to help you. If L&D is at the initial stage, where it still has to prove its value, you should focus on effectivity indicators. If the organizational culture of the company is development-oriented, your priority might be to assess the quality of training. Agnieszka Drabik, Lead EX Insights & Analytics at Philip Morris International, comes to similar conclusions based on her experience. - Verify the knowledge delivery processes and try to measure them at various stages.
This piece of advice is given by Karol Wolski, Change and Development Manager, founder of HRM Academy. Control the effectiveness of these processes, the accuracy of the KPIs, the speed of data delivery, and data usability. Gather feedback from team members and stakeholders at each stage to make sure that the data acquired complies with their goals. - Start from smaller goals.
Margaret Roth, CEO at Yet Analytics, says that you should focus on smaller goals, to begin with, even though learning analytics offers such unlimited possibilities. This will help you build the necessary experience to examine the strategic problems within the organization. - Be proactive rather than reactive.
Do not try so hard to prove your value by means of data. Instead of studying the traditional L&D metrics, combine them with your business goals. For example, rather than check the number of participants in a course, compare employee performance in a given area before and after the course. Try to identify the KPIs before designing the training scheme, not afterwards. - Use the data for various purposes.
Rafał Salamonik from BNP Paribas Bank emphasizes the need for constantly raising awareness in the organization to be able to make the right and creative use of the collected data. “Only this attitude will lead you toward insight-driven culture,” according to Rafał. - Analyze the long-term effects of L&D activities.
Even if this means receiving the data with delay.
McKinsey Academy divides the L&D performance indicators by their use in the following way:
- Business – check how all the L&D initiatives and investments align with your business priorities.
- Learning process in the organization – check if L&D activities change people’s behavior and influence their performance.
- Operation – check how well L&D investments and resources are used.
The scope of knowledge you will gain by making use of various kinds of indicators will surely be impressive. Nevertheless, many organizations keep relying on standard KPIs, such as training satisfaction and learning resources quality. They overlook the more essential indicators: the impact of the training on individual performance, employee engagement, team effectivity, and facilitation of business processes.
According to experts from McKinsey Academy, you need to ask yourself the following questions concerning the effectivity of L&D in your organization:
- How effectively does the learning strategy support the organization’s priorities?
- How well does the L&D function help colleagues build the mindsets, skills, and expertise they need most?
- How well do the L&D activities influence employee performance and help colleagues achieve maximum impact in their role while maintaining a healthy work-life balance?
What are the sample KPIs that are worth taking into account in L&D?
The most popular KPIs measured for L&D usually include:
- The learning process – completed training programs, time spent learning, exam scores.
- The participants’ learning experience – satisfaction, technology, training formats.
- Learning program – content, drop-off rates, exam success rates.
These metrics may come in handy, but they not always do. They are not related to the business goals. Indicators that take the business goals into account measure training performance in terms of the following:
- Learning pace – how much time does a learner need to become proficient in a given subject?
Sample KPI: employee performance before and after the course. - Level of knowledge acquisition and consolidation in the company – there is no doubt that knowledge is best absorbed in small chunks, at regular intervals.
Sample KPI: level of knowledge before and after the course. - Level of knowledge-to-skill conversion.
Sample KPI: evaluation of task performance based on a new methodology, carried out on the job, as part of a simulation, or a game-based project. - Impact of L&D actions on the company’s and individual employees’ performance.
Sample KPI: employee efficiency before and after the course.
- Net Promoter Score – how likely is it that a participant will recommend the course to his or her colleagues?
- Stakeholders’ satisfaction.
When choosing the L&D indicators, you need to give priority to those that you believe to help you in being proactive and strategy-oriented, rather than reactive. Such indicators enable you to concentrate on the future and your plans instead of focusing on past events. As far as development is concerned, keep in mind that according to the 70:20:10 model, only 10% of knowledge comes from training. The other 20% is derived from other people, e.g. through coaching or mentoring, and 70% originates from daily activity. Andrzej Borczyk stresses out that in business environments, these processes usually take place between the manager and the employee. In this case, your indicator might be the measure of how the manager supports the development of employees. Karol Wolski proposes the OKR framework (Objectives & Key Results) as an efficient tool of employee development measurement, adding annual performance review to that. Agnieszka Drabik recommends the latter as well.

How to handle learning data?
The learning analytics strategy is generally created for three reasons. Firstly, its goal is to customize the training experience and adjust the course offer to the employees’ needs. Secondly, the strategy is meant to improve the quality of all the educational activities within the organization.
Thirdly, the influence of learning and development at the company on its business goals must be demonstrated. Steve Foreman from InfoMedia Designs believes that a learning data strategy must consist of seven steps:
- Considering the reasons for collecting and analyzing learning data.
- Listing the questions that need answering.
- Prioritizing the list of questions.
- Identifying data to inform the answers.
- Assessing the reliability of available data.
- Defining the requirements for accessing data.
- Specifying how the data is going to be viewed (reports, dashboards, and so on).
How to work with learning data?
Naturally, collecting data based on the previously defined indicators is not everything you need to do. The next steps are equally important as they allow you to justify the need for introducing learning analytics before the stakeholders as well as the profits it will bring to the organization. The steps you should take at this point are the following:
- Data analysis, including:
- Checking the reliability of the acquired information by comparing it with another reliable source (if possible);
- Identifying gaps in the data that could be made up for at this stage;
- Verifying the usability of the data, taking the goals of the stakeholders into consideration (you might need to remove some irrelevant data from the report);
- Deep understanding of the data – if you want to present the results in a reliable manner, you need to know what they show and what conclusions can be drawn from them.
- Using the data to plan your future activities:
- Start from simple improvements that bring quick profits – this will help you secure the support of the stakeholders and give you arguments for possible investments;
- Evaluate the data collection process, along with its quality and relevance to the business goals;
- Take a look at the data from various points of view and add new sources of data – this will increase their reliability and help you make better decisions;
- Collect the data periodically and discuss the results with the stakeholders to identify any anomalies and emerging patterns;
- Involve specialists in various disciplines in your activities to gain new perspectives of looking at your decisions and actions;
- Use the data for various purposes – carefully scrutinize the related indicators and look for the explanations for unexpected results, at the same time seeking a wider use for them within the organization;
- Verify the usability of KPIs – add new ones and remove the useless ones, if necessary;
- Ask for help – if you have no idea how to interpret the positive and negative variances, find an expert who will help you explain them;
- Get an insight into the results using qualitative methods – collecting data by means of IT tools is a great help but it will not account for all the nuances that can be discussed in direct conversation.
How to measure, what are the ways and tools to measure KPIs in L&D?
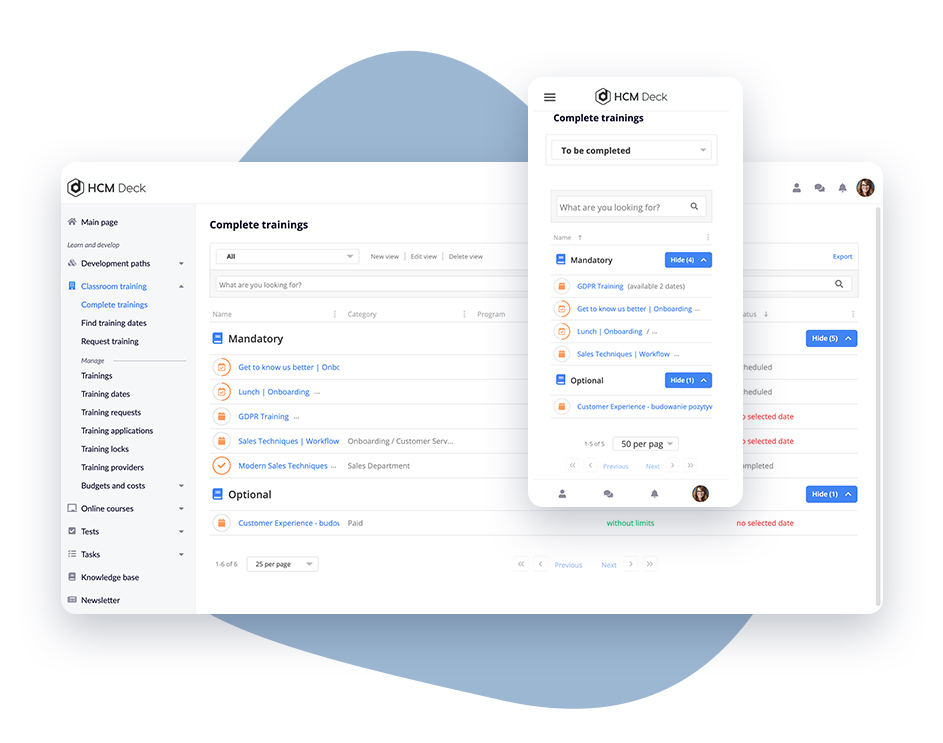
The choice of tools is an important element of the analytics strategy in an organization, as these tools will help you gather your data. Companies that use training platforms and sophisticated technology solutions are able to analyze data from various sources and correlate them. This is a crucial aspect of applying predictive and prescriptive analytics. Organizations at a lower technological level, especially those with a large number of employees, must allow for some limitations concerning data collection. Which tools are the most popular?
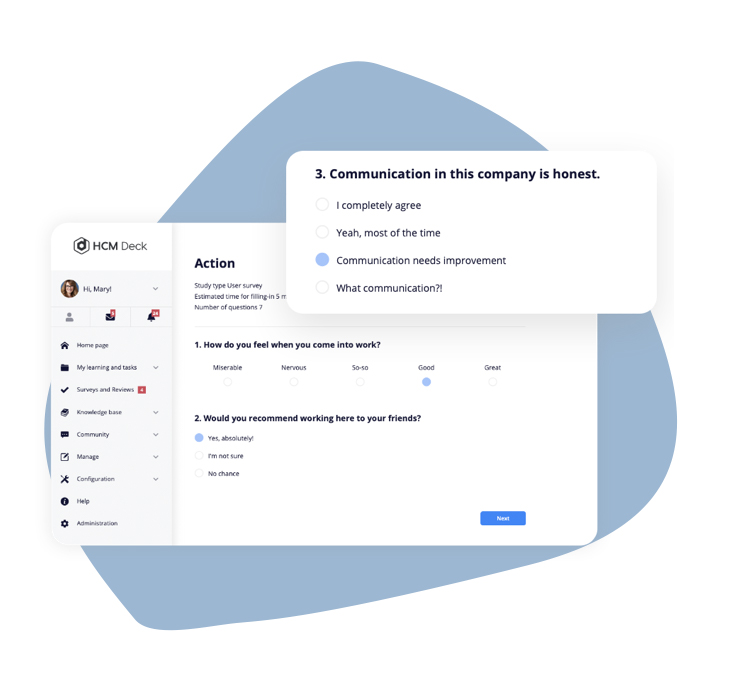
Post-training surveys
This is one of the most commonly used training evaluation tools. No wonder! Feedback gathered from participants is a valuable source of informative data, although it is not often fully used. This is caused by the nature of questions that get asked: normally, they are focused on the satisfaction of the course participants. However, the fact is that the role of L&D initiatives is not to ensure satisfaction on both sides but to achieve efficiency, effectiveness, and efficacy to support specific business goals. Karol Wolski believes that participants are too seldom asked how they want to use their knowledge in practice at work and whether they can do that at all. As Karol says, “a survey may be really useful as long as it is constructed in the right way: it should check whether the surveyed person intends to make use of their knowledge, whether they can do it, and what elements are problematic.”
Too little time is usually spent on the development of post-training surveys. They are not on the top of the tutor’s checklist – they are drawn up at the very end, after preparing training contents and resources. Such questionnaires really deserve more time: various types of questions should be used to encourage the participants to answer them reliably and with interest. However, acquiring information concerning the participants’ positive opinions about the course, their post-training knowledge, and their willingness to put it into practice is not enough to assess the success of the course. This process should be perceived from a broader perspective. To do this, you can make use of The New Kirkpatrick Model®, which is successfully employed in numerous organizations.
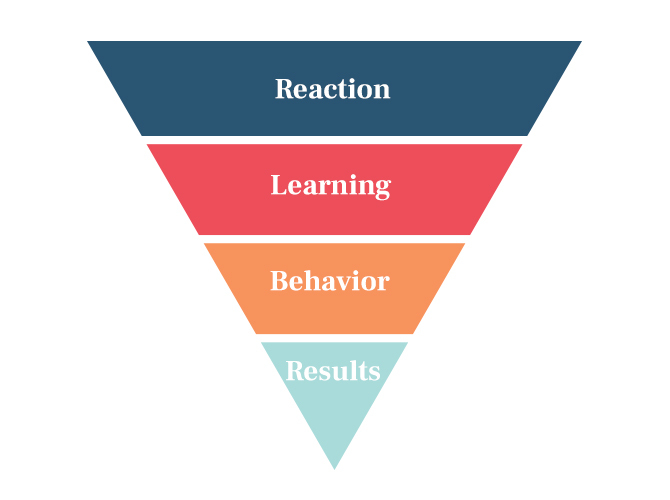
The New Kirkpatrick Model®
If you’re an L&D specialist, you surely know what this model is. In the traditional Kirkpatrick Model, evaluation was carried out on the basis of four levels: reaction, learning, behavior, and results. In the modern approach, the planning of training processes begins by defining the benefits they should bring to the participants and the organization. The New Kirkpatrick Model® is reversed to become a tool of complex change management with training as one of its most significant elements. To ensure this, the scope of particular evaluation levels is extended and they serve as points of reference for creating surveys and questionnaires. They should include questions referring to all the categories to enhance the evaluation process by means of additional tools and metrics.
Performance review
The traditional form of performance review, involving the appraisal of the employees’ tasks and competencies, is increasingly objected to by the followers of modern management models (Josh Bersin says that they are actually “universally despised”). However, this type of assessment is still an important part of the employee life cycle in an organization, as it can bring a number of benefits. Annual reviews are perfect for revising training KPIs. They can be used to track the progress of individual employees, to draw overall conclusions, and to plan further steps based on them. Agnieszka Drabik recommends using annual reviews to discover the reasons for the increase in performance of individual employees. You need to find out what triggered a change to track that employee’s development path and, perhaps, apply a similar scheme to other employees.

Employee Net Promoter Score
The eNPS metric is used to evaluate employee loyalty and satisfaction levels. When it comes to learning processes, it can be successfully used to assess the satisfaction levels of your internal clients. This tool is pretty easy to use, as it is built on a single question with the answer to be marked on a scale:
- How likely are you to recommend the course you have just taken part in to your colleagues?
By using the eNPS to evaluate the training results, you can identify the promoters, the passives, and the detractors in relation to the training. If you apply this measurement regularly, you will be able to keep updated about the changes in staff attitudes toward the development activities. Gaining insight into the results of this survey and juxtaposing them with other indicators may contribute significantly to your plan-making aimed at increasing employee satisfaction that influences your business objectives. High eNPS in terms of onboarding training may also increase the retention rate.
Pulse-check surveys
Pulse-check surveys are perfect when the internal or external circumstances of an organization undergo dynamic and unpredictable changes. In fact, these characteristics describe the present reality, which is why these short and quick surveys (qualitative and quantitative) are growing in popularity, replacing the standard employee engagement surveys. In the context of L&D, there are plenty of areas to explore, but you need to focus on these which are strictly related to your business goals. You need to ask the leaders about their views on the L&D program aimed at the employees. Karol Wolski has observed that companies do that very rarely, even though this is such a valuable indicator that defines the usability of training in relation to the needs of the organization. Pulse-check surveys may also be of use when it comes to defining the needs of the employees as such and discovering skills gaps among the staff.
How to calculate the ROI of learning analytics?
In the fourth level of the Kirkpatrick Model, the measurement of the effectiveness of training must be connected with its business impact. The information you get at this stage of evaluation may help you calculate the return on investment. Although L&D experts differ in their opinions on this subject (you will find out more about this later in the text), calculating ROI should not just be a good practice – it needs to become a regular element of learning analytics. Learning processes in an organization cannot only come down to knowledge acquisition as such, accompanied by employee satisfaction. What matters is the outcome. According to a study by Brandon Hall Group, the number one driver for developing a learning strategy is to align L&D goals with the goals of the business. This should be reflected in actual employee performance improvements and, consequently, increase the profits. Finding this relationship, especially in times of crisis, is imperative for L&D departments.
How to estimate ROI based on L&D indicators? You need to calculate the company’s pre-training cost, the cost of training delivery, the performance after the training, and the net benefit to your company.

How to avoid failure in the last stages of the learning analytics process?
Despite the growing awareness concerning learning analytics and the experience of trainers, many learning-related activities are still ineffective. As estimated in the DDI forecast, only 21% of companies succeed in terms of performance using traditional descriptive and diagnostic analytics. The statistics are even lower for companies implementing more advanced forms of analytics – only 18% percent of them succeed in this field. These results are in marked contrast to the opinions of HR specialists: 70% of them have reported an increase in their analytical skills. Trish Uhl, creator of the Learning Systems Engineering Framework™, finds reasons for that in the inability to translate analytical output into operational execution. According to her, this has less to do with deficits in data, data science, or statistics, and more to do with deficits in people engagement. What to do in order not to fail on the last mile?
- At each stage of operation, revise your business strategy goals to make sure they align with your L&D strategy.
- Create a clear, regular process of bilateral communication including all stakeholders. Share opinions, conclusions, and doubts to make better decisions and plans for further development, which will help you increase the value, scope, and strategic impact of L&D actions on the whole organization.
- Implement L&D solutions which respond to the employees’ needs and deliver business value.
It is also important to maintain a client-centered approach in HR activities. The internal clients must also feel that their needs are taken into consideration. And these needs are diverse, as they depend on the target group. Executives strive for business value and return on investment, the managers want the results to be measured against operational KPIs, supporting departments (such as IT or Finances) want proof that L&D interventions are worth their time, attention, and resource allocation, whereas frontline employees wish to know how they are going to benefit from all that.
Trish Uhl suggests that an analytical approach should be taken to each perspective by transforming them into sets of well-articulated questions. These questions are meant to guide you toward the appropriate indicators. However, you need to look beyond the standard KPI sets. One of the fundamental mistakes made by HR departments is using the same obvious data over and over again. Only by changing your attitude, trying new things, and discovering the undiscovered tracks will you be able to show how investing in learning analytics can significantly transform business.
The case studies of using learning analytics in organizations
Data-driven organizations are not a trend – they are a necessity. Their goal, however, is not to gather information but leverage it for their development. Below, you will find several examples of successful implementation of L&D analytics in organizations that have proven its effectiveness by their impact on their performance and solving actual business problems.
Sky – how to outwit your competition
When the media giant began its widespread digital transformation several years ago, they realized that their L&D initiatives had to be reinvented as well. They needed to be agile in that, as their competition was rapidly growing. The L&D team, in agreement with the whole organization, resigned from cohort-based program which took months to implement. Instead, they introduced a new approach aiming to change the employees’ mindset. The employees started to gain control over their own development. The L&D team focused on solving their problems. In practice, that corresponded with their user-centered approach and enabled taking data-based decisions. The pivot of their method was quick identification of educational needs with the use of adequate digital solutions, including the help of UX and experts.
InterContinental Hotels Group – can training change behavior?
The L&D team at the InterContinental Hotels Group used a tool to analyze a course whose aim was to improve the quality of communication with customers. The platform’s data scientists demonstrated that 50% of participants had seen how they could put their knowledge into practice and 12% of participants had actually tried a new behavior. Based on conversations with the leaders who took part in the course, three levels of behavior were identified. At the first level, learners were able to speak about the new knowledge, at the second level, they expressed a desire to change, and at the third level, they reported back on how they tried to do something new, reflecting on how it went and on how they might do things next time. Working with unstructured qualitative data and semantic analysis provided IHG with hard evidence that the course had been successful in its objectives.
DKSH Malaysia – how predictive analytics can help HR offer proactive business solutions
DiethelmKellerSiberHegner is a Swiss holding company specializing in market expansion services, such as outsourcing. Jeffrey Ng, Senior Director, Country HR at DKSH Malaysia, says: “In line with our HR vision to become a strategic business partner, we have started leveraging on people analytics in our decision-making for more than five years now.” To do this, they use a centralized database linked to a variety of tools and platforms. This data is analyzed to find patterns and trends, which leads to smarter decision-making increasing employee engagement and efficiency. The HR cooperates closely with the Technology and Innovation team to be able to use the data to come up with practical solutions for the company. Since the adoption of this model, employee retention and engagement rates in the organization have improved, and DKSH has introduced even more market-competitive compensation and benefits plans. As Jeffrey Ng says, “despite the growth in the business, we have improved our turnaround time to fill vacancies within 30 days by 15%, by leveraging on insights of talent mapping for key and critical positions.”
How do experts differ on ROI in L&D?
To calculate or not to calculate? What’s the point? L&D specialists have been asking themselves these questions for years and there have been numerous clashes between the adherents and the opponents of the use of ROI as a reliable indicator in assessing the profitability of training. The main doubts that arise in the context of calculating ROI in L&D concern the following issues:
- The level of complexity of calculation;
- The use of this indicator mainly to prove the value of the L&D department;
- The evaluation of past events, disregarding the process itself and conclusions for future actions.
What do L&D experts say about ROI?
“Many organizations recognize that ROI is a process-improvement tool […]. The ROI methodology not only shows the success of a particular project, program or solution, but also provides the details of how the project can be revised to add additional value. Barriers and enablers to success are always identified.” – Jack J. Phillips, Ph.D., expert at FranklinCovey Company
“ROI has been gamed by L&D for years, but we find it is generally used by L&D functions to show their own value. We mostly consider ROI a dead metric, meaning it gives you a report card on something you have already done, rather than providing you information that helps you facilitate improvement in the future.” – Dani Johnson, co-founder and principal analyst at RedThread Research
“The ROI of training has a lot in common with a box of chocolates: what you see is not necessarily what you get. This is not a big issue with chocolates, but it is serious business with ROI. Crucial business decisions are often made based on ROI calculations, but below its surface may lie distortions of the truth.” – Ron Drew Stone, president of the Center for Performance and ROI and author of a book titled The Real Value of Training: Measuring and Analyzing Business Outcomes and the Quality of ROI
“Investment in talent and L&D should be about a genuine passion and belief that good people will lead to great performance. That is where the true ROI lies. The trouble is that society has this increasing fixation on risk. All risks must be reduced to a bare minimum and that translates across the workplace in terms of how we recruit, invest in and shape our teams today.” – Chris Sheppardson, CEO at EP Business in Hospitality
Conclusion
The amount of data generated by humans all over the world may be overwhelming. It is estimated that people create 2.5 quintillion bytes of data per day and counting. In the last two years, 90% of all data existing today was created. In this maze of information, it gets more and more difficult to find data that brings real value: this refers to the business as well. Do we really need so much information? Perhaps. However, its usability depends on the context and the purpose it serves. Is it all about the development of an organization and, above all, the people who work there? Undoubtedly.
Business cannot ignore this aspect in planning profit growth, just like Learning & Development departments cannot function in separation from the company goals. IDC reveals that 60% of the surveyed companies plan to invest in employee experience digitalization in 2021 to change the relationship between employers and employees. It is predicted that by 2022, 70% of all organizations will use digital technologies to transform existing business processes, improve customer engagement, enhance employee productivity, and increase their competitive advantage. The world of data is a great place for business. Now it’s time for L&D departments to find their way there.
***
